Introduction
A sentinel event happens. A surveyor cites a deficiency. Now the clock is running, and your team needs to prove not just what went wrong, but why, and what you're doing about it.
Regulators don't leave this to chance. CMS Conditions of Participation, Joint Commission's Sentinel Event Policy, and state surveyors all require documented root cause analysis (RCA) and corrective action/preventive action (CAPA) plans after adverse events and deficiencies.
The problem? Many compliance, quality, and risk teams still run this process across disconnected spreadsheets, shared drives, and paper trackers. Deadlines slip. Findings repeat. Evidence gets lost between departments.
This article breaks down the top 7 RCA and CAPA tools healthcare teams actually use, along with guidance on picking the right one for your situation. It also covers how modern governance platforms are closing the gaps that manual tracking leaves open.
TL;DR
- RCA finds why an event happened; CAPA documents the fix and prevents recurrence
- Techniques scale from simple (5 Whys, Fishbone) to advanced (FMEA, FTA) based on severity
- The right tool depends on complexity, available data, and how defensible the finding must be
- Software increasingly replaces manual tracking to prevent missed deadlines and lost evidence
- Platforms like ComplyGovern connect RCA findings directly to policies, evidence, and dashboards
Overview of RCA & CAPA in Healthcare Compliance
Root cause analysis is the structured process of identifying the underlying cause behind a sentinel event, incident, or non-conformance, not just the surface-level symptom. CAPA is what happens next: the documented corrective action (fixing the immediate problem) and preventive action (stopping it from recurring elsewhere).
Healthcare organizations don't get to choose whether to do this work. The regulatory backdrop is specific:
- Joint Commission requires hospitals to complete a comprehensive systematic analysis and corrective action plan within 45 business days of a sentinel event or becoming aware of it
- Under 42 CFR 482.21(c)(2), CMS requires hospital QAPI programs to track medical errors and adverse events, analyze their causes, and implement preventive actions with organization-wide feedback and learning
Neither regulation names a single required technique. That's intentional. Different findings call for different tools, which is exactly what the next section breaks down.
Top 7 Root Cause Analysis & CAPA Tools and Techniques
These methods range from quick brainstorming exercises to statistical and software-based approaches. Most healthcare teams combine two or three, depending on how serious the event is.
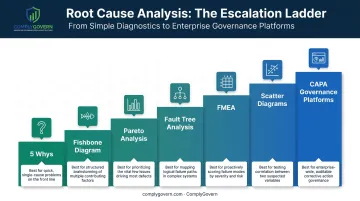
1. 5 Whys
You ask "why" repeatedly, typically around five times, starting from the problem statement until you land on something actionable. It's the fastest way to move past symptoms without needing specialized training.
This tool works best for straightforward incidents with a linear cause chain, like a single missed step in a medication administration process. CMS itself notes the technique is useful but doesn't guarantee you'll find the true root cause, so pair it with validation before closing the loop.
| Aspect | Detail |
|---|---|
| How It Works | Ask "why" repeatedly starting from the problem statement until reaching an actionable cause |
| Best Fit | Low-complexity incidents, quick investigations, frontline team use |
| Healthcare Example | Tracing a missed dosage back to an unclear handoff protocol |
2. Fishbone (Ishikawa) Diagram
Teams map a problem to major cause categories, commonly People, Process, Equipment, Environment, and Materials, then branch out possible contributing factors under each. It's a visual way to organize hypotheses before anyone commits to a single root cause.
This works particularly well in cross-functional brainstorming sessions involving nursing, risk, and quality staff. AHRQ's own RCA training pairs Fishbone with 5 Whys, using the "whys" to surface details and the diagram to structure them.
| Aspect | Detail |
|---|---|
| How It Works | Plot the problem at the "head" and branch out cause categories for team brainstorming |
| Best Fit | Events with multiple plausible contributing factors requiring group input |
| Healthcare Example | Investigating a cluster of patient falls across a unit |
3. Pareto Analysis
Built on the 80/20 principle, Pareto analysis ranks incident types, complaints, or deviations by frequency so teams know where to focus limited resources. Instead of chasing every finding equally, you tackle the categories driving the most volume.
This is especially useful when resources are tight and findings keep piling up. OIG's own review of nursing home deficiencies found the top 10 of 340 deficiency types accounted for more than 40% of citations, a real-world example of how a small number of categories drive most of the problem.
| Aspect | Detail |
|---|---|
| How It Works | Rank incident categories by frequency/impact using a Pareto chart |
| Best Fit | Recurring issues needing prioritization across multiple departments |
| Healthcare Example | Identifying which documentation gaps drive the majority of survey citations |
Keep in mind: frequency tells you where to look, not why it's happening. Pareto ranks the problem; it doesn't solve it.
4. Fault Tree Analysis (FTA)
FTA starts at the adverse outcome and works backward, using AND/OR logic to map how combinations of failures led to the result. It's more rigorous than Fishbone because it forces you to show exactly how failures combined, not just list them.
Reserve this for high-stakes, high-scrutiny events where a defensible, auditable causal model matters, think wrong-site surgery or a medication error that slipped through multiple safety checks.
AHRQ notes FTA requires specialized training and is more commonly used for prospective failure prediction than routine retrospective sentinel-event review. Bring in someone experienced before relying on it for a formal investigation.
| Aspect | Detail |
|---|---|
| How It Works | Start from the adverse event and work backward using AND/OR logic to map contributing failures |
| Best Fit | High-severity, high-scrutiny events requiring rigorous documentation |
| Healthcare Example | Investigating a medication error that reached the patient despite multiple safety checks |
5. Failure Mode and Effects Analysis (FMEA)
FMEA flips the script: instead of investigating after something goes wrong, you score potential failure modes on severity, occurrence, and detectability before a process goes live. Multiply the three scores together and you get a risk priority number that tells you where to focus prevention efforts.
Joint Commission requires hospitals to select one high-risk process and conduct a proactive risk assessment at least every 18 months. FMEA is the tool most organizations reach for to meet that requirement, though the standard itself doesn't mandate FMEA by name, any structured proactive assessment qualifies.
| Aspect | Detail |
|---|---|
| How It Works | Score potential failure modes on severity, occurrence, and detectability to calculate a risk priority number |
| Best Fit | Prevention work before rolling out a new process, device, or workflow |
| Healthcare Example | Assessing failure risks before implementing a new medication reconciliation workflow |
6. Scatter Diagrams & Statistical Correlation
Plot two variables against each other, say nurse-to-patient ratios against fall rates, and you can see whether a suspected relationship actually shows up in the data. If the points cluster into a line or curve, that's a signal worth investigating further.
This technique doesn't generate hypotheses on its own. It validates ones already raised in a Fishbone or 5 Whys session. IHI is direct about the limitation here: correlation on a scatter plot doesn't prove causation, so treat it as one input among several, not a final verdict.
| Aspect | Detail |
|---|---|
| How It Works | Plot suspected cause against outcome to visually identify correlation |
| Best Fit | Validating a hypothesis with quantitative data before finalizing a root cause |
| Healthcare Example | Correlating nurse-to-patient ratios with fall incident rates |
7. CAPA Management & Governance Platforms
Beyond manual techniques, more organizations now use dedicated software to formally document RCA findings, assign corrective actions, set deadlines, and verify effectiveness over time. This is less about generating the root cause and more about making sure the finding doesn't get lost after the meeting ends.
Platforms purpose-built for healthcare compliance, such as ComplyGovern, link RCA findings directly to policies, regulatory standards, and evidence, replacing the spreadsheet-and-email chain with a single auditable record that compliance, quality, and risk teams can all see.
| Aspect | Detail |
|---|---|
| Key Capabilities | Automated corrective action tracking, deadline alerts, evidence capture, effectiveness verification |
| Healthcare Fit | Built to map findings to CMS, Joint Commission, and state requirements across facility types |
| Example Platform | ComplyGovern's Governance Intelligence Engine linking findings to controls and dashboards |
How to Choose the Right RCA & CAPA Approach
There's no universal best tool. The right choice depends on:
- Event severity: a routine near-miss doesn't need FTA-level rigor
- Regulatory scrutiny: sentinel events and repeat findings demand a defensible causal chain
- Available data: scatter diagrams only work if you have quantitative history to plot
- Team expertise: FMEA and FTA need someone trained to run them properly
Many organizations layer methods together. A team might start with Fishbone to generate hypotheses, then use a scatter diagram to confirm which cause the data actually supports before finalizing the CAPA plan.
Common Mistakes to Avoid
- Stopping at the first plausible cause. Unvalidated explanations often resurface as the same finding at the next survey.
- Skipping effectiveness checks. OIG found Kansas lacked evidence of correction for an estimated 52% of reviewed nursing home deficiencies, a gap seen repeatedly across states.
- Working in silos. Disconnected RCA and CAPA tools hide linked findings, letting duplicate investigations become routine across compliance, quality, and risk teams.
How ComplyGovern Strengthens RCA & CAPA Management
ComplyGovern's Governance Intelligence Engine automatically links every RCA finding to related regulations, policies, controls, and prior corrective actions. That connection matters: it's what stops three departments from independently investigating the same root cause.
The platform's Incident & Corrective Action module handles the full lifecycle:
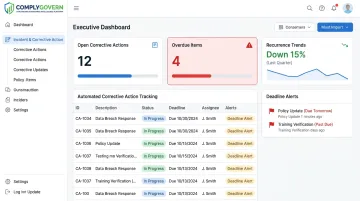
- Automated corrective action tracking with deadline alerts to help teams meet RCA/CAPA completion windows tied to sentinel events and survey deficiencies
- Effectiveness tracking built as a distinct step, not just a "closed" checkbox after the plan is submitted
- Executive and board dashboards giving leadership real-time visibility into open corrective actions, overdue items, and recurrence trends
ComplyGovern also integrates with clinical platforms including Epic, Oracle Health (Cerner), MEDITECH, and athenahealth, so evidence supporting an RCA investigation can be pulled directly from source systems rather than requested department by department.
Over time, organizations move from reactive, survey-driven CAPA scrambles toward continuous, audit-ready governance.
Conclusion
No single RCA or CAPA tool fits every situation. Matching the technique to the event's severity and the regulator's expectations is what actually prevents repeat findings, not picking the fanciest method available.
Before your next survey cycle, ask a harder question than "did we document the finding?" Can your current process track corrective actions all the way to closure, and prove they worked? If the honest answer is spreadsheets and email chains, see how a unified platform handles it instead.
See how ComplyGovern connects RCA and CAPA tracking with governance, compliance, and quality management in one place.
Frequently Asked Questions
What are the tools used in root cause analysis?
Common tools include 5 Whys, Fishbone diagrams, Pareto analysis, Fault Tree Analysis, FMEA, scatter diagrams, and CAPA governance software. Teams often combine several depending on event complexity.
What is the 5 Whys tool for root cause analysis?
It's an iterative questioning method where you ask "why" repeatedly, usually around five times, to move from a symptom to an actionable cause. It works best for straightforward, low-complexity incidents.
What is the difference between RCA and CAPA?
RCA identifies the underlying cause of an event or non-conformance. CAPA is the documented corrective and preventive action plan that follows, fixing the immediate issue and preventing recurrence.
How long does a hospital have to complete a root cause analysis after a sentinel event?
Joint Commission requires hospitals to complete a comprehensive systematic analysis and corrective action plan within 45 business days of the event or becoming aware of it.
What is the best root cause analysis method for healthcare organizations?
It depends on severity. Simple tools like 5 Whys or Fishbone suit routine issues, while FTA and FMEA are reserved for high-stakes events requiring a defensible, auditable causal chain.
Can RCA and CAPA processes be automated?
Governance platforms like ComplyGovern automate evidence capture, deadline tracking, and effectiveness verification, but human judgment still drives the actual investigation and root cause determination.